Aurora is an award-winning Airy Beam Light Sheet imaging system designed for researchers working in fields such as neuroscience, developmental biology, cancer biology, regenerative medicine and other bioscience disciplines, including Plant Sciences and Marine Biology. Compact, affordable and customisable, Aurora is available as a single and multiphoton light sheet fluorescence microscope for rapid, large 3D volumetric imaging, high resolution, multicolour, time-lapse imaging and live cell imaging. Aurora uses ground-breaking Airy Beam Light Sheet imaging techniques to achieve outstanding results in the field. It is currently in use by many leading organisations delivering results previously not possible.
The ability to accurately image large structures at cellular resolution is fundamental to modern biological understanding. Light sheet fluorescence microscopy is an increasingly popular imaging technique for producing high contrast 3D volumetric images of intact biological specimens.
The fundamental principle is to illuminate the sample with a sheet of light at a 90° angle to the detection objective. The entire field of view can be recorded 500-1000x faster than laser point scanning microscopy and with minimal photon damage to the specimens and fluorophores.
The majority of current light sheet microscopes use a Gaussian profile laser beam to illuminate a sample, which directly affects the possible field of view and the resolution, leading to a compromise that limits the size of the imaging plane.
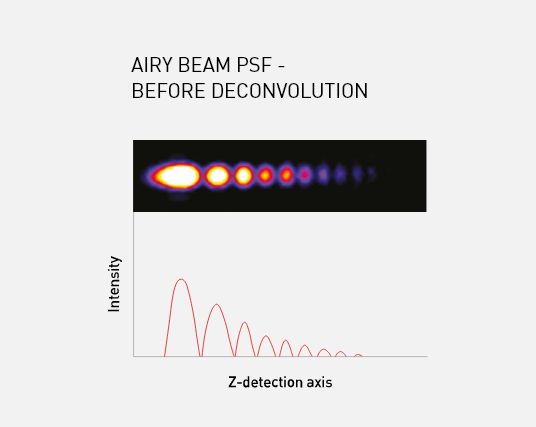
The Aurora imaging system resolves these issues by using a ‘self-healing’ Airy beam, described as such due to the curved nature of the Airy profile; even after the beam has passed through the sample, the profile is retained minimising any shadowing effects.
The Airy beam’s ability to be extended and retain its asymmetric excitation pattern enables the full field of view (up to 870 um x 870 um) to be captured while still maintaining 1 μm near isotropic resolution. The asymmetric excitation pattern also provides deeper penetration and lower phototoxicity, due to the distribution of laser power throughout the Airy lobes.
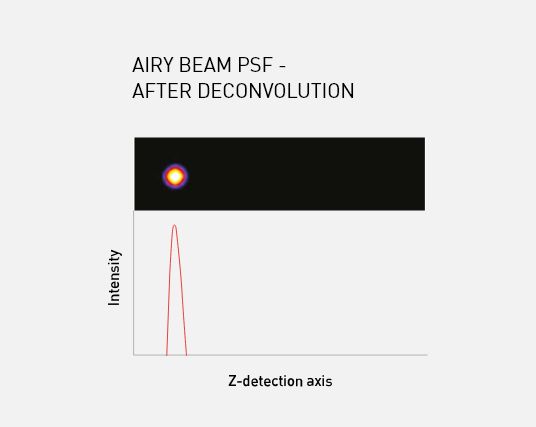
M Squared Life’s Aurora Deconvolution software captures and restores the information encoded within the Airy lobes, improving signal-to-noise by a factor of 10 and delivering images with high contrast and resolution.
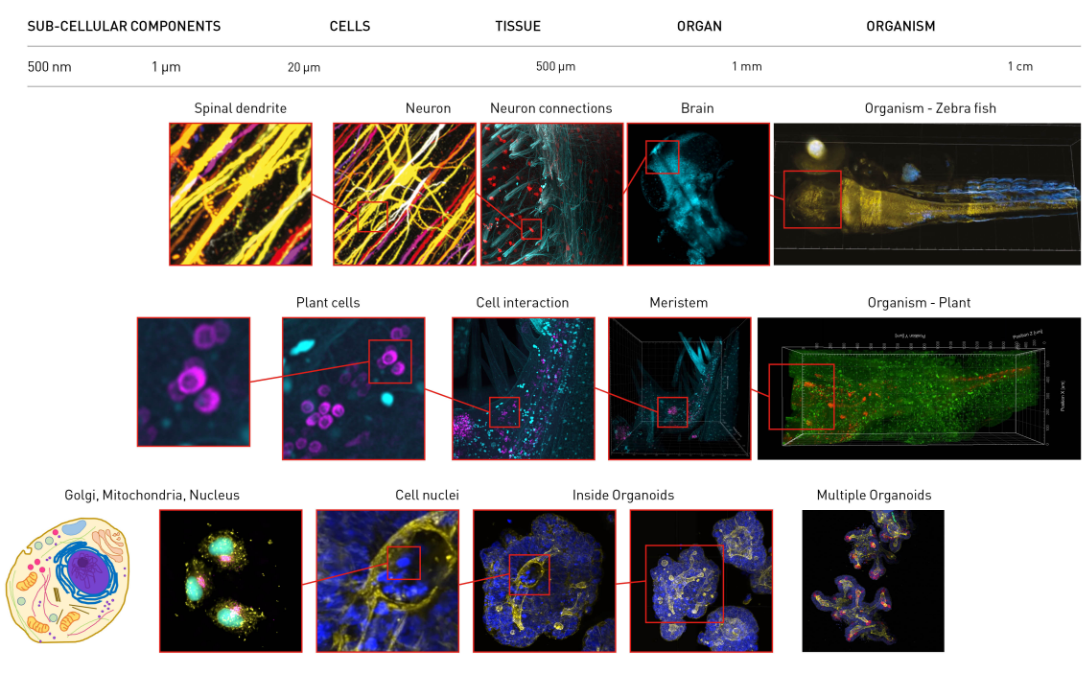
Aurora is able to image at sub-cellular resolution over entire organisms. These images show whole organisms >10mm across down to sub-cellular components <1 µm across.
Aurora is not only transformative; it is a flexible and affordable instrument that addresses the current limitations in other light sheet systems.
Aurora is very flexible and can be tailored to meet your specific scientific research requirements. Join our custom development programme, and you can choose the initial level of system complexity, to which you may add a range of modules or laser lines as your research demands.
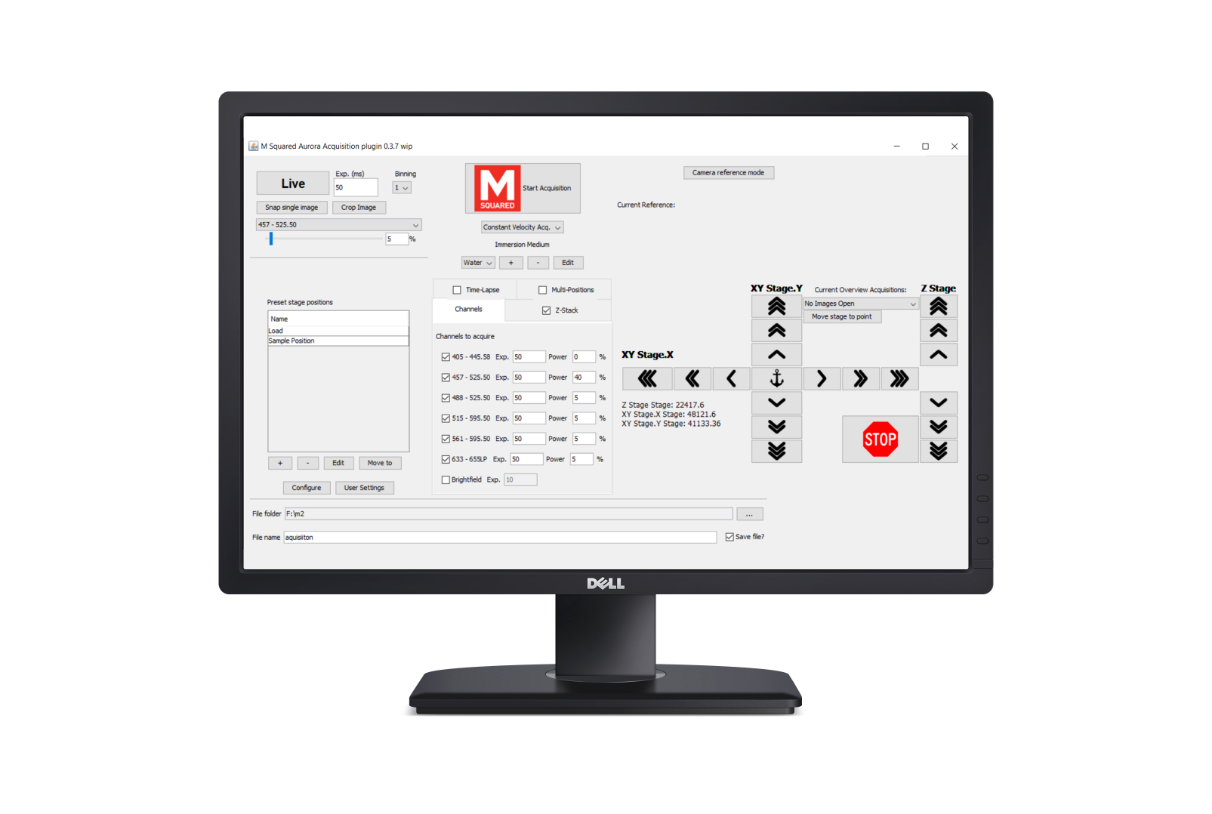
Aurora’s user driven evolution has guided the development of a fully featured user friendly graphical user interface, which has been designed to allow you to flexibly build your experiments then automatically control the microscope.
Unique to the Aurora system is its continuous velocity acquisition, allowing imaging of specimen volumes with no delay thereby speeding up your image acquisition routines.
The Aurora Custom Development Programme enables you to customise an instrument with the functionality to suit your research. It has proven extremely beneficial to leading laboratories across many fields of study.
Once you join the programme, you’ll start collaborating with M Squared’s imaging specialists who will focus on your research and tailor the configuration and specifications of Aurora to your needs.
Personalise the programme Tailor the programme to suit your budget and timescales
Develop a custom system Choose from a range of modules to create a customised system
Dedicated application support Our Application Specialists will work with you to optimise your applications imaging parameters
Priority technical support Dedicated application specialists and engineers on hand to support you
Hands-on-training Practical assistance to help you optimise sample imaging protocols
Grant application support Use our grant writing team to aid funding applications for an Aurora system
Preferential purchase terms Earn purchase terms that reflect your collaboration input
Co-author papers Produce papers in conjunction with M Squared and other programme members
The layout of the Aurora instrument provides an extremely flexible specimen area with an incredible observation volume. For a microscopy service unit in particular, the wide flexibility of the system is of immense interest as you may use it to address a lot of different challenges. The potential of the system is very promising which is leading us to think of new imaging approaches we never had in mind before.
DR STEFAN VOLKERY Max Planck Institute for Molecular Biomedicine, Bio-optic Service Unit
Our biology collaborators have been trying to image the zebrafish using competing light sheet imaging modalities, but the three-dimensional pictures of the forming gut region deep inside the living zebrafish taken by the Aurora light sheet microscope have a quality which is by far superior to the competing modalities.
PROFESSOR LENE BROENG ODDERSHEDE Niels Bohr Institute, University of Copenhagen
We use Aurora for a wide range of volumetric fluorescence imaging experiments in our lab. In particular, we find the capability of the system to rapidly image large samples with sub um spatial resolution make it well suited to studying 3D cell cultures and multicellular models, which is helping us to investigate structural changes in tumour organoids in response to therapeutic drug treatment.
DR MIKE SHAW Senior Research Scientist, National Physical Laboratory
M Squared opened its specialised biophotonics division, M Squared Life, at the Surrey Research Park in 2015. Since its formation, M Squared has worked closely with Kishan Dholakia’s group at the University of St Andrews to develop a portfolio of products using innovative biological imaging techniques. Its award-winning Aurora imaging systems are the first transformative imaging technologies to be released into the market.
Or if you’d prefer to speak to someone in person, please phone +44 (0)1483 685 170
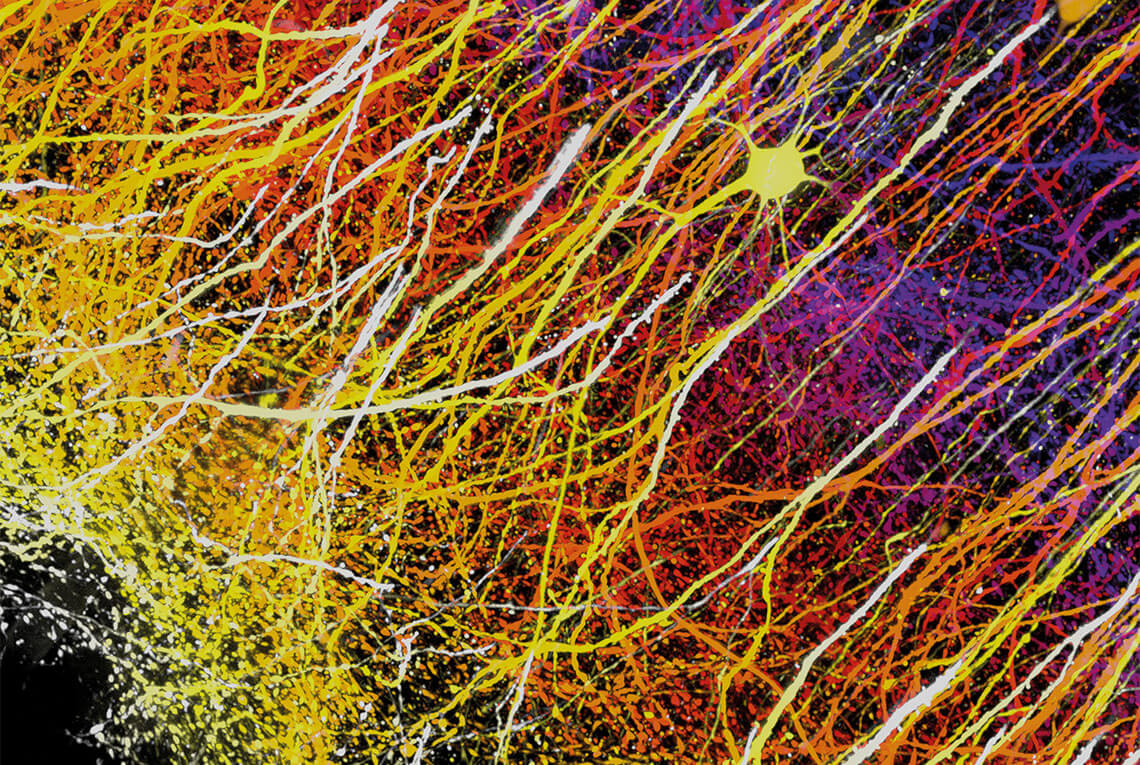
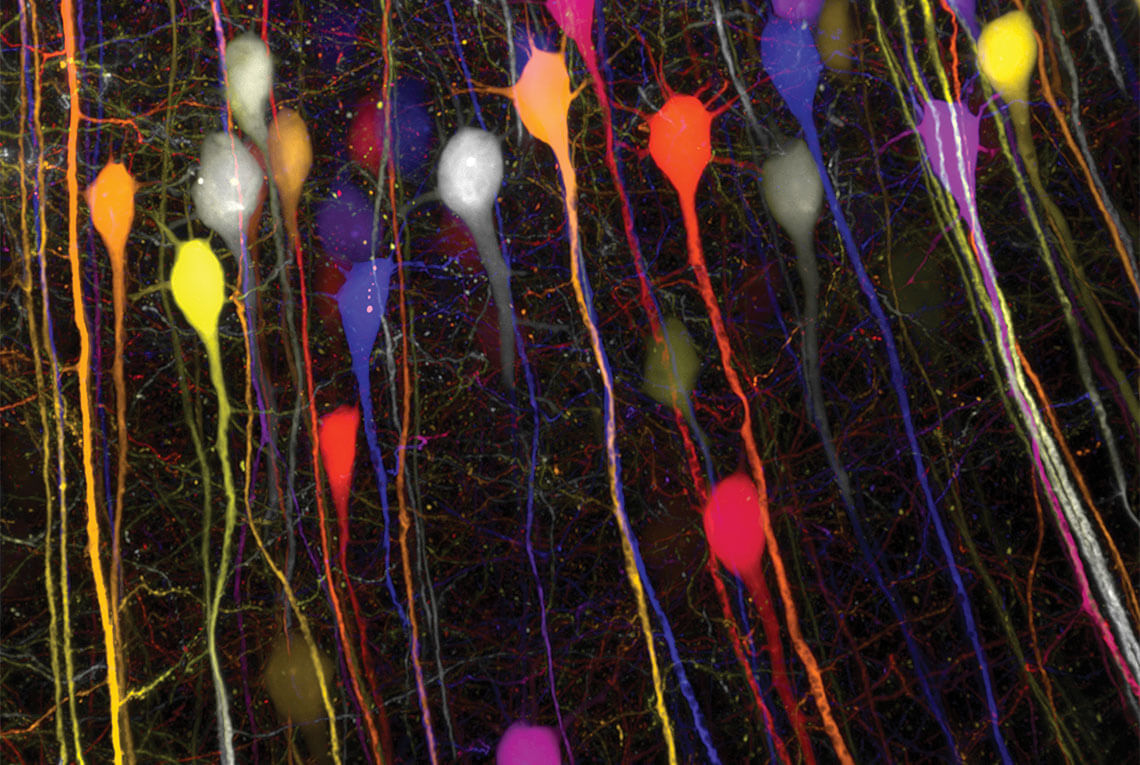
*1 Maximum intensity projection of an optically cleared mouse brain expressing thy1-GFP Actin using a coloured height map. Original dataset was 600x600x1,000 micrometres. Image courtesy of Dr Anthony Vernon and Robert Chesters, Department of Basic and Clinical Neuroscience, Maurice Wohl Clinical Neuroscience; MRC Centre for Neurodevelopment Disorders, King’s College London.
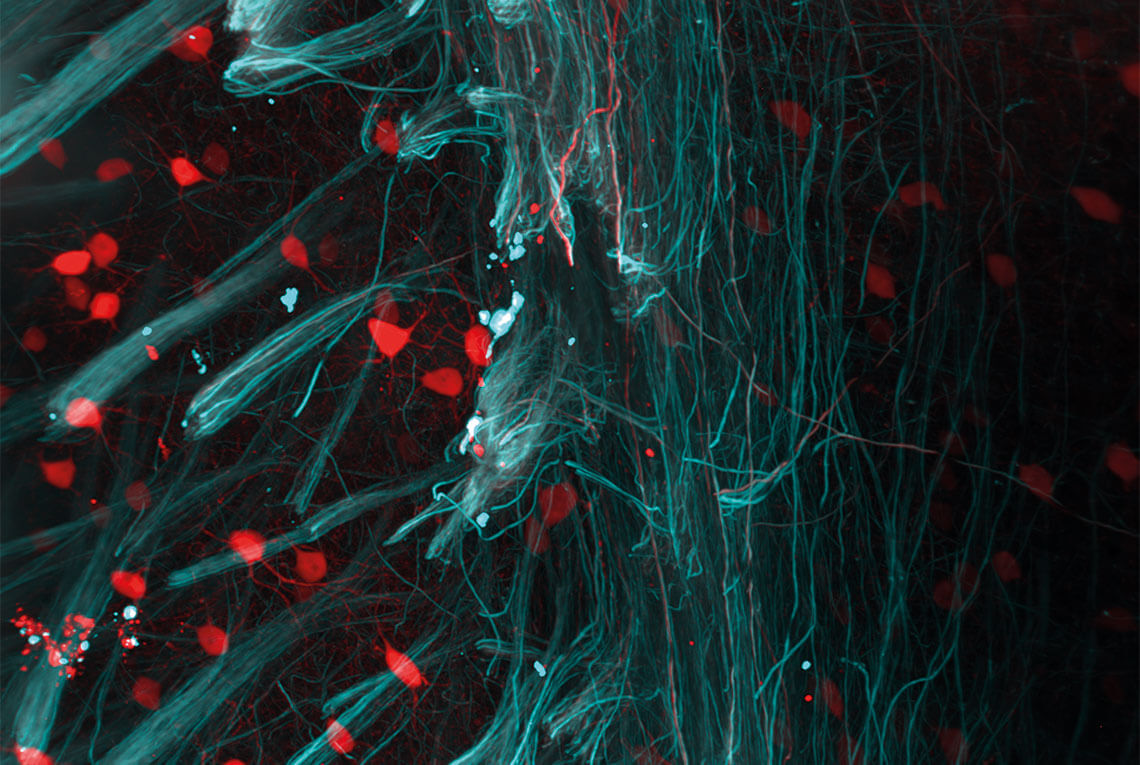
*2 Maximum intensity projection of an optically cleared mouse brain labelled with Alexa 488-Neurofilament (Cyan) and Alexa 568-Parvalbumin (Red). Original dataset was 800x800x1,000 micrometres. Image courtesy of Adam Tyson, MRC Centre for Developmental Neurobiology, King’s College London
*3 Maximum intensity projection of an optically cleared mouse brain expressing thy1-GFP Actin using a coloured height map. Original dataset was 600x600x640 micrometres. Image courtesy of Dr Anthony Vernon and Robert Chesters, Department of Basic and Clinical Neuroscience, Maurice Wohl Clinical Neuroscience; MRC Centre for Neurodevelopment Disorders, King’s College London.
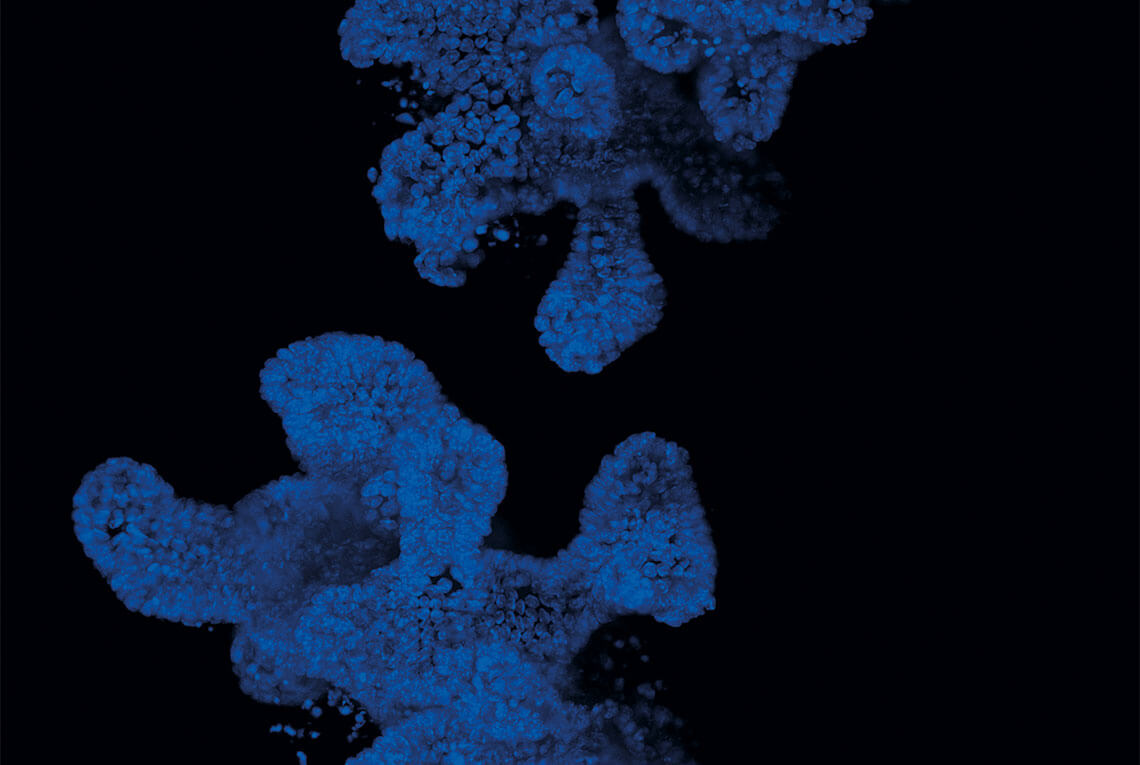
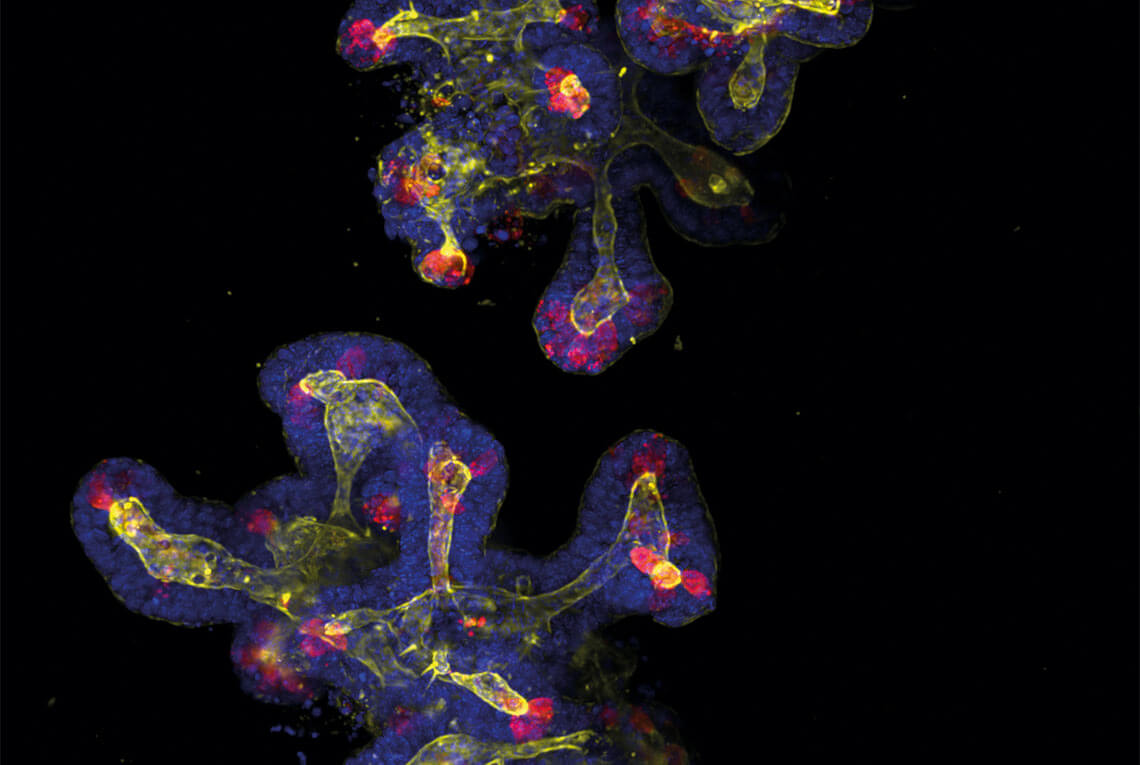
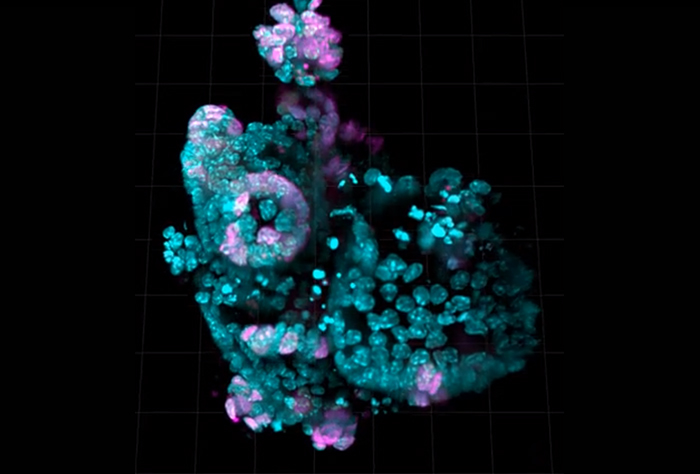
*4 Maximum intensity projection of 2-week old mouse intestine organoids. The image shows label of 4 colours: DAPI staining the nuclei (Blue), AF647-Phalloidin staining Actin, AF555-WGA staining the Paneth cells, and GFPLGR5 expressing in the stem cells. Original dataset was 600x600x200 micrometres. Image courtesy of Dr Sandra Scharaw and Dr Sylvie Le Guyader, Karolinska Institute, Department of Biosciences and Nutrition.
*5 Maximum intensity projection of mouse small intestine organoids labelled with Hoechst (DNA, blue) and EdU (proliferating cells and newly synthesised DNA, pink). Image courtesy of Dr. Gavin Bewick and Dr. Patricia Fonseca Pedro, Diabetes and Nutritional Sciences Division, Kings College London.
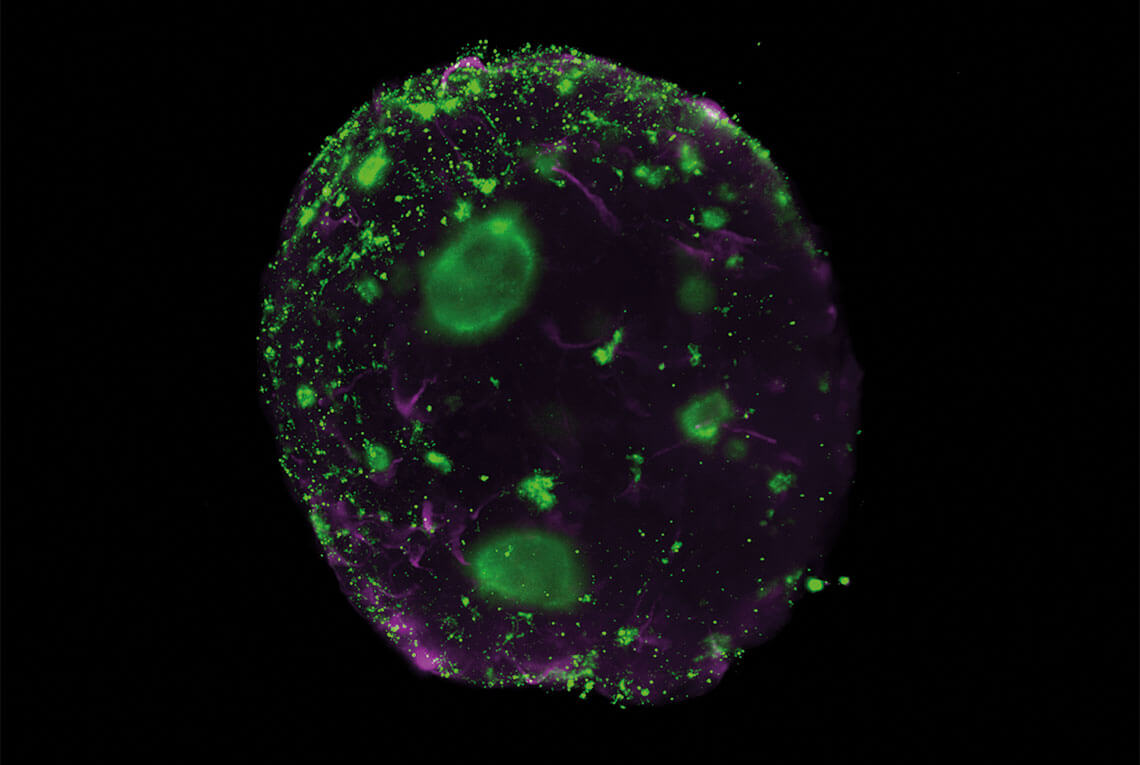
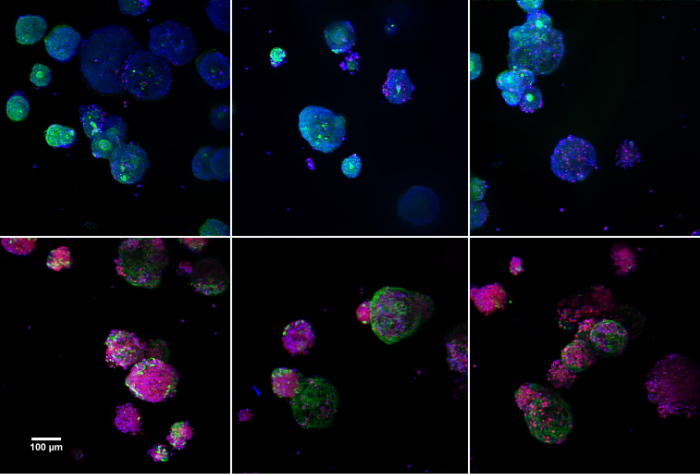
*6 Using light sheet microscopy to monitor anticancer effects in tumour organoids - Images show colorectal tumour organoids labelled with Hoechst (DNA, blue), Calcein-AM (metabolically active cells, green) and Propidium iodide (necrotic / apoptotic cells, red). The top row shows control (untreated) organoids. Organoids in the bottom row have been treated with a novel anticancer peptide developed at NPL. Peptide-based therapeutics have significant potential in a range of applications from treating cancer to combating antimicrobial resistance and NPL is developing measurement standards and metrological techniques to support their development and testing. The organoids have been provided by Cellesce (www.cellesce.com) and cultured and imaged live at the National Physical Laboratory (www.npl.co.uk/biometrology).
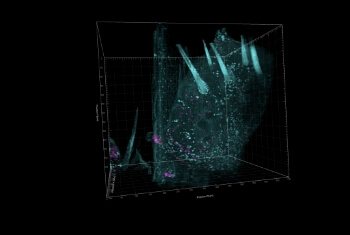
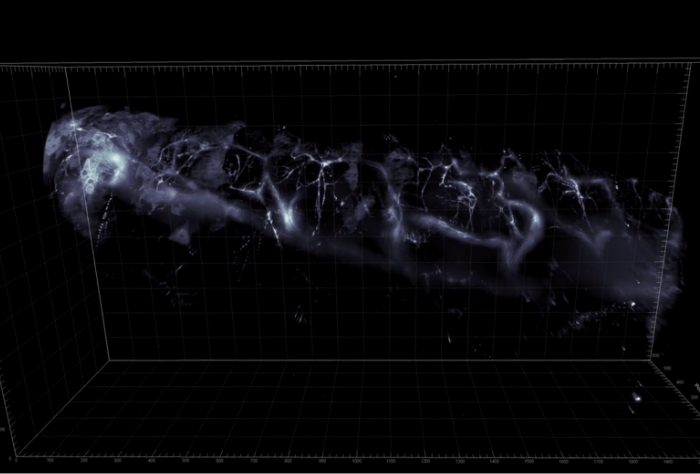
*7 3D Volumetric Projection of a Drosophila larva: trachea-specific protein breathless (btl) drosophila line, with a tracheal GFP marker. AURORA was used to monitor branching of the trachea. Original dataset was 2100x1100x600 micrometres. Sample provided courtesy of Anna Aalto and Annika Meinander, Turku Bioimaging /Turku Bioscience Centre, University of Turku and Åbo Akademi University.
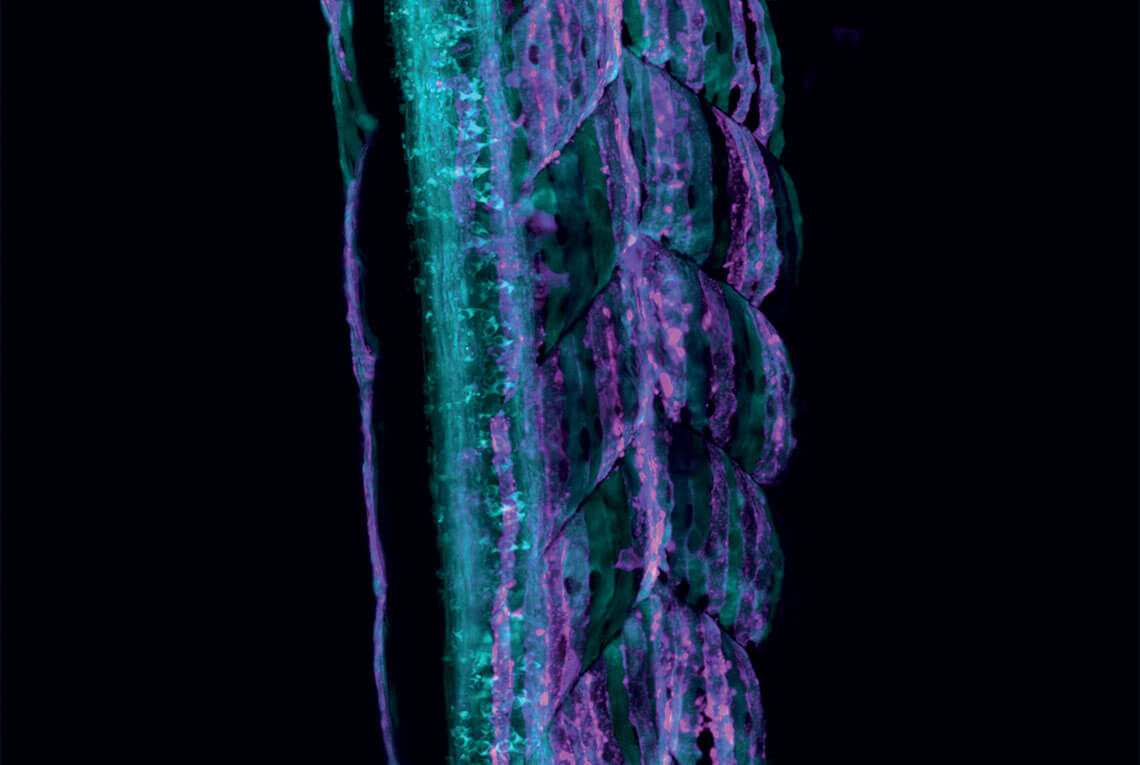
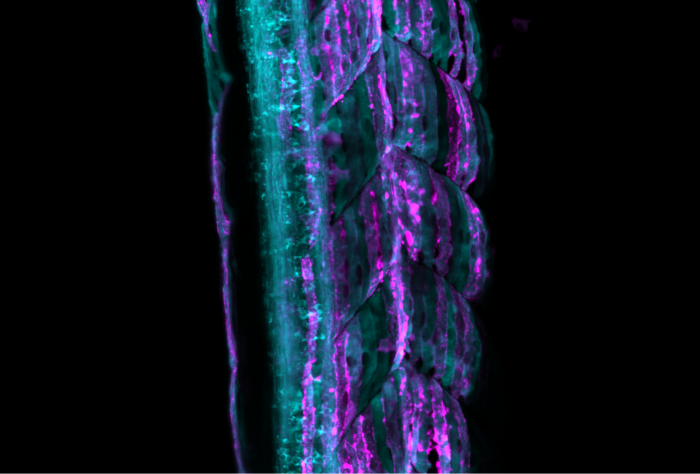
*8 Maximum intensity projection of a living 2-day old zebrafish tail, labelled with GFP-sox17 (Cyan) and RFPprox1( Magenta). Original dataset was 600x600x400 micrometres. Image courtesy of Professor Lene Broeng Oddershede, Dr Younes Farangebarooji and Dr Elke Ober, Niels Bohr Institute Copenhagen.
*9 Maximum intensity projection of a living 2-day old zebrafish tail, labelled with GFP-sox17 (Cyan) and RFPprox1( Magenta). Original dataset was 600x600x400 micrometres. Image courtesy of Professor Lene Broeng Oddershede, Dr Younes Farangebarooji and Dr Elke Ober, Niels Bohr Institute Copenhagen.
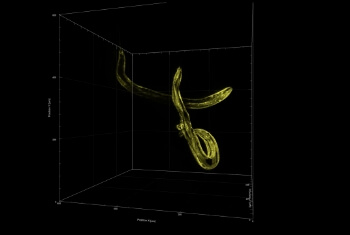
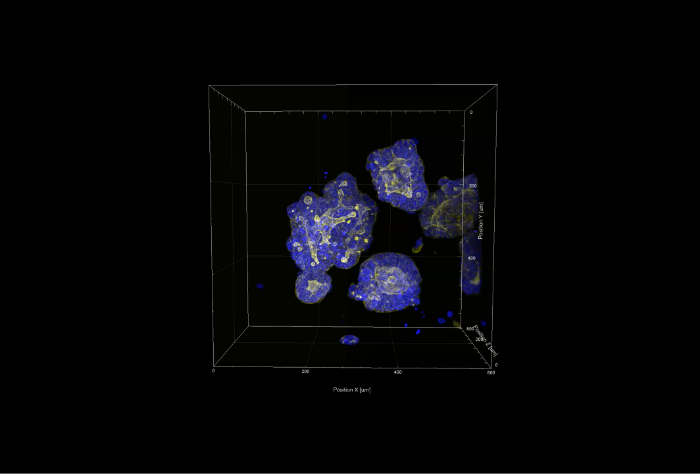
*10 Colorectal tumour organoids stained with Hoechst (DNA, blue) and TRITC-Phalloidin (F-actin, yellow). Original dataset was a volume of 600x600x600 micrometres. Organoids prepared by Cellesce and imaged at the National Physical Laboratory by Dr Mike Shaw..
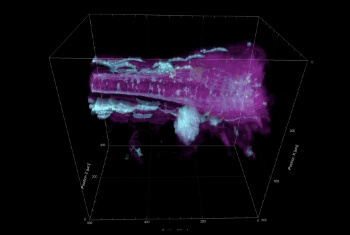
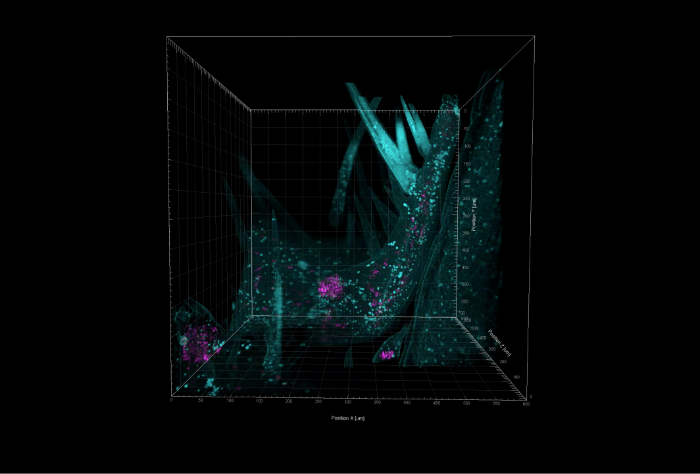
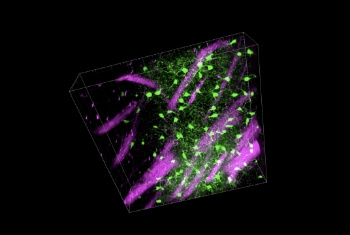
*11 3D volumetric projection of mouse hindbrain expressing GFP- CX3CR1 (Green) overlaid with the native autofluorescence (Magenta). Original dataset was a multi-photon excited volume of 600x600x200 micrometres. Image courtesy of Dr Anthony Vernon and Robert Chesters, Department of Basic and Clinical Neuroscience, Maurice Wohl Clinical Neuroscience; MRC Centre for Neurodevelopment Disorders, King’s College London.
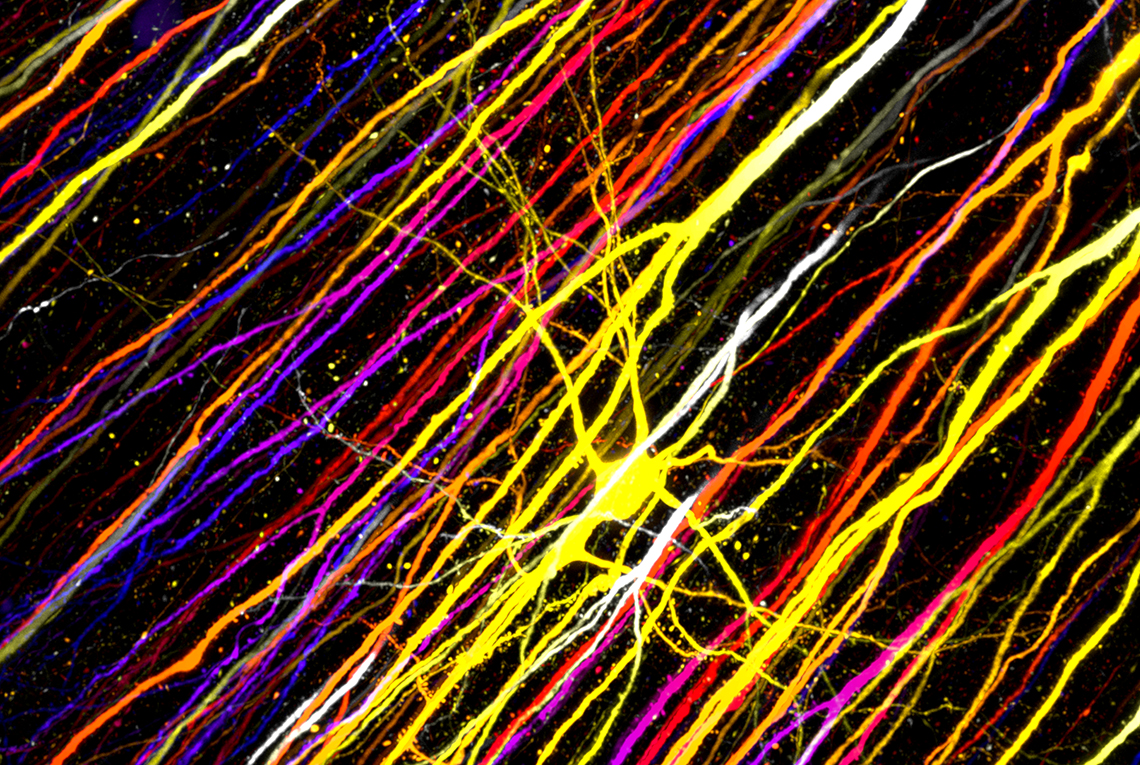
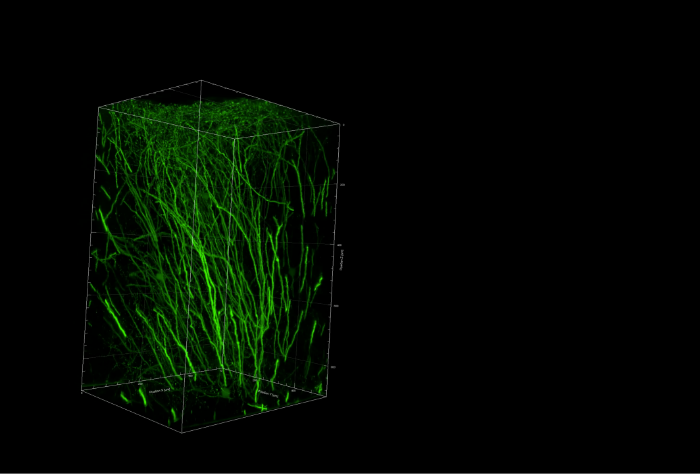
*12 Thy1-GFP expressing neuron imaged in CLARITY cleared mouse hippocampus. Sample provided courtesy of Dr Anthony Vernon and Robert Chesters, Department of Basic and Clinical Neuroscience, Maurice Wohl Clinical Neuroscience; MRC Centre for Neurodevelopment Disorders, King’s College London.
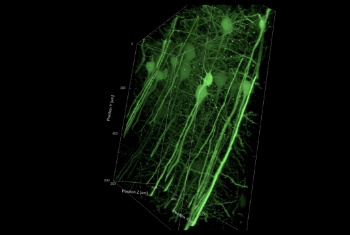
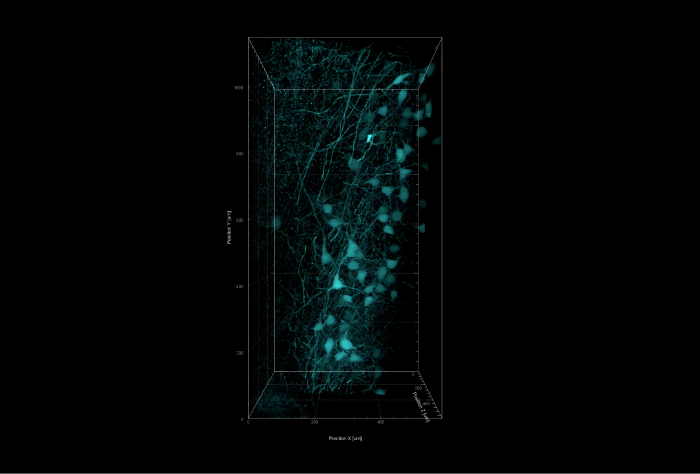
*13 Two Photon stack of thy1-gfp expressing neurons in mouse striatum cleared with Clarity. Sample provided courtesy of Dr Anthony Vernon and Robert Chesters, Department of Basic and Clinical Neuroscience, Maurice Wohl Clinical Neuroscience; MRC Centre for Neurodevelopment Disorders, King’s College London.
*14 3D volumetric projection of an optically cleared mouse brain expressing thy1-GFP Actin. Original dataset was 600x1000x600 micrometres. Image courtesy of Dr Anthony Vernon and Robert Chesters, Department of Basic and Clinical Neuroscience, Maurice Wohl Clinical Neuroscience; MRC Centre for Neurodevelopment Disorders, King’s College London
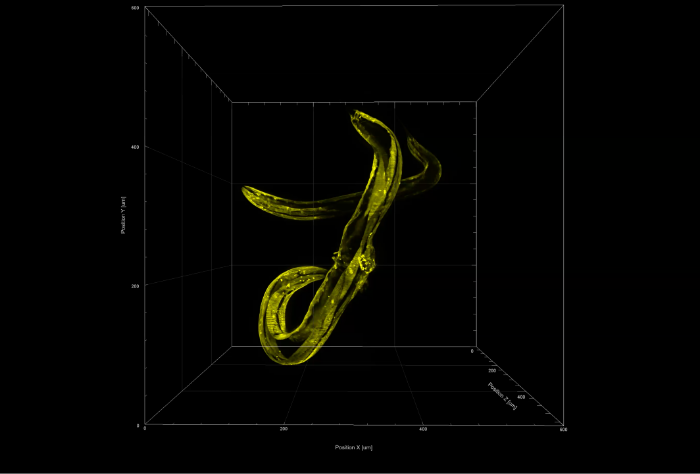
*15 3D volumetric projection of 2 adult C. elegans specimens expressing fluorescent protein in their body wall muscles. Original dataset was 600x600x600 micrometers. Strains courtesy of Dr Serena Ding, MRC London Institute of Medical Sciences. Samples prepared by Dr Muna Elmi, University College London. Images captured by Dr Mike Shaw, National Physical Laboratory
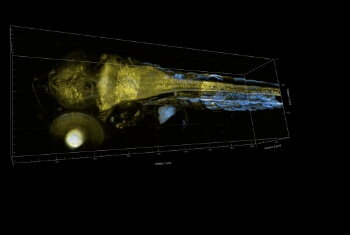
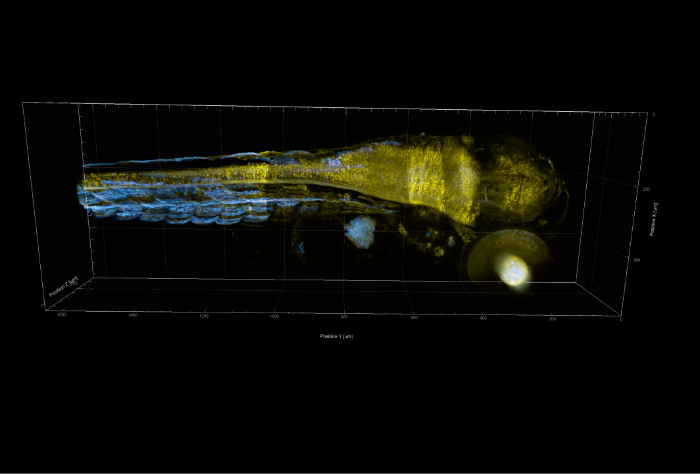
*16 3D volumetric projection of a stitched dataset of 3 Z-stacks. It shows a living 2-day old zebrafish from head to tail midbody, labelled with GFP-sox17 (Cyan) and RFP-prox1(Yellow). Original dataset was 1,700x600x400 micrometres. Image courtesy of Professor Lene Broeng Oddershede, Dr Younes Farangebarooji and Dr Elke Ober, Niels Bohr Institute Copenhagen.
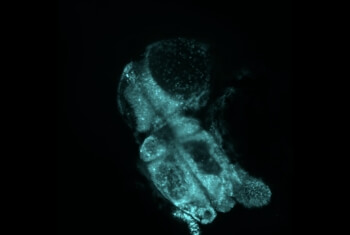
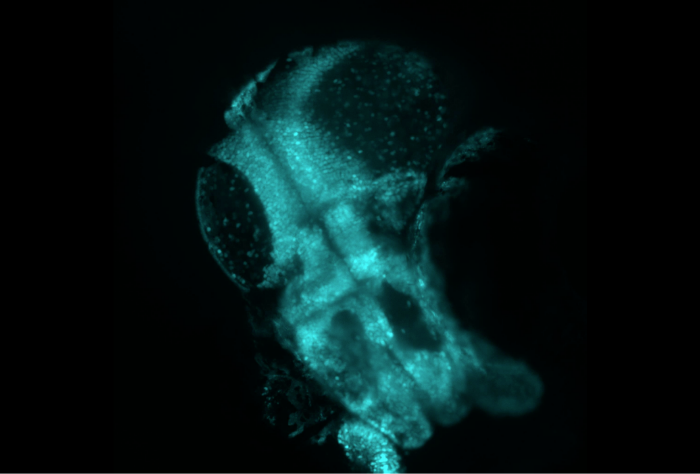
*17 Progression through a Z-stack of a 1 week-old Zebrafish Larvae with Transgenic Expression of GCaMP in the brain. Original dataset was 600x600x400 micrometres. Image courtesy of Thomas Shallcross and Thomas Sainsbury, MRC Centre for Developmental Neurobiology, King’s College London.
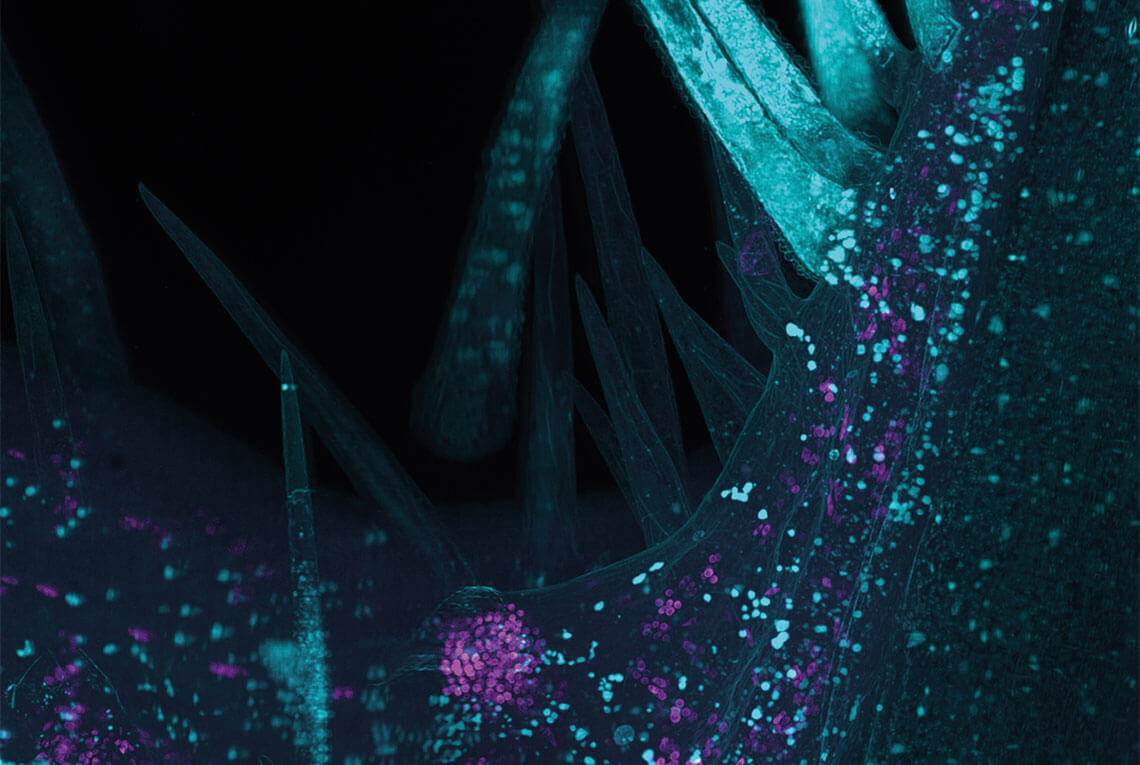
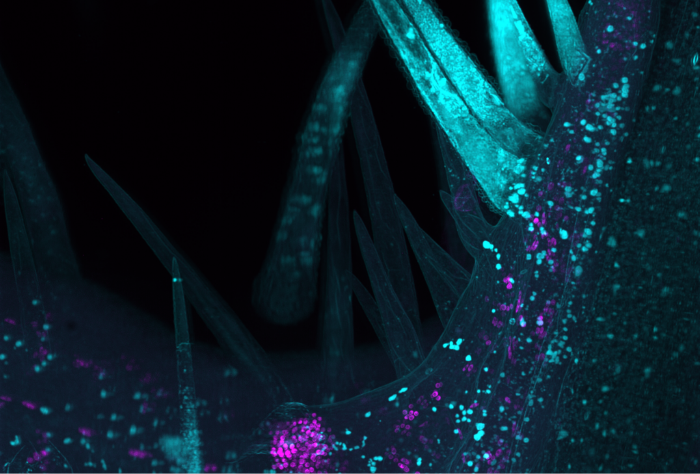
*18 3D volumetric projection of a Meristem (leaf shoot) of an Arabodopis plant expressing GFP-CHDR5 (Magenta) overlaid with the plant’s native autofluorescence (Cyan). Original dataset was 600x600x1,000 micrometres. Image courtesy of Ton Timmers, Max Planck Institute for Plant Breeding Research.
Phone +44 (0)141 945 0500
Head Office
Phone +1-617-401-2368
USA
Phone +44 (0)1483 685170
M Squared Life